
Other Actions: Analytics
Introduction
This documentation provides a comprehensive guide on the Khoros Flow Analytics user interface, covering configuration steps, running and modifying reports, descriptions of each module within the Flow Analytics tab, and additional context to help users better understand the aspects of the reports.
Analytics Components
1. Interactions
Overview
The Interactions section in Flow Analytics shows the total number of conversations handled by the system or passed to an agent over a selected time period. It provides a clear view of resolved and unresolved conversations, helping users track customer engagement and agent performance.
Key Features
- Resolved vs. Unresolved: The chart uses blue for resolved and gray for unresolved interactions, making it easy to compare daily performance.
- Flexible Date Range: Users can switch between day, week, or month views. In the screenshot, the This month option is active.
- Channel Filters: Users can filter results by communication channels (for example, chat or email) using the drop-down menu at the top right.
- Hover-Over Insights: Hovering over a date shows exact numbers for that day. For example, on September 3rd, there were 2 resolved and 1 unresolved interactions.
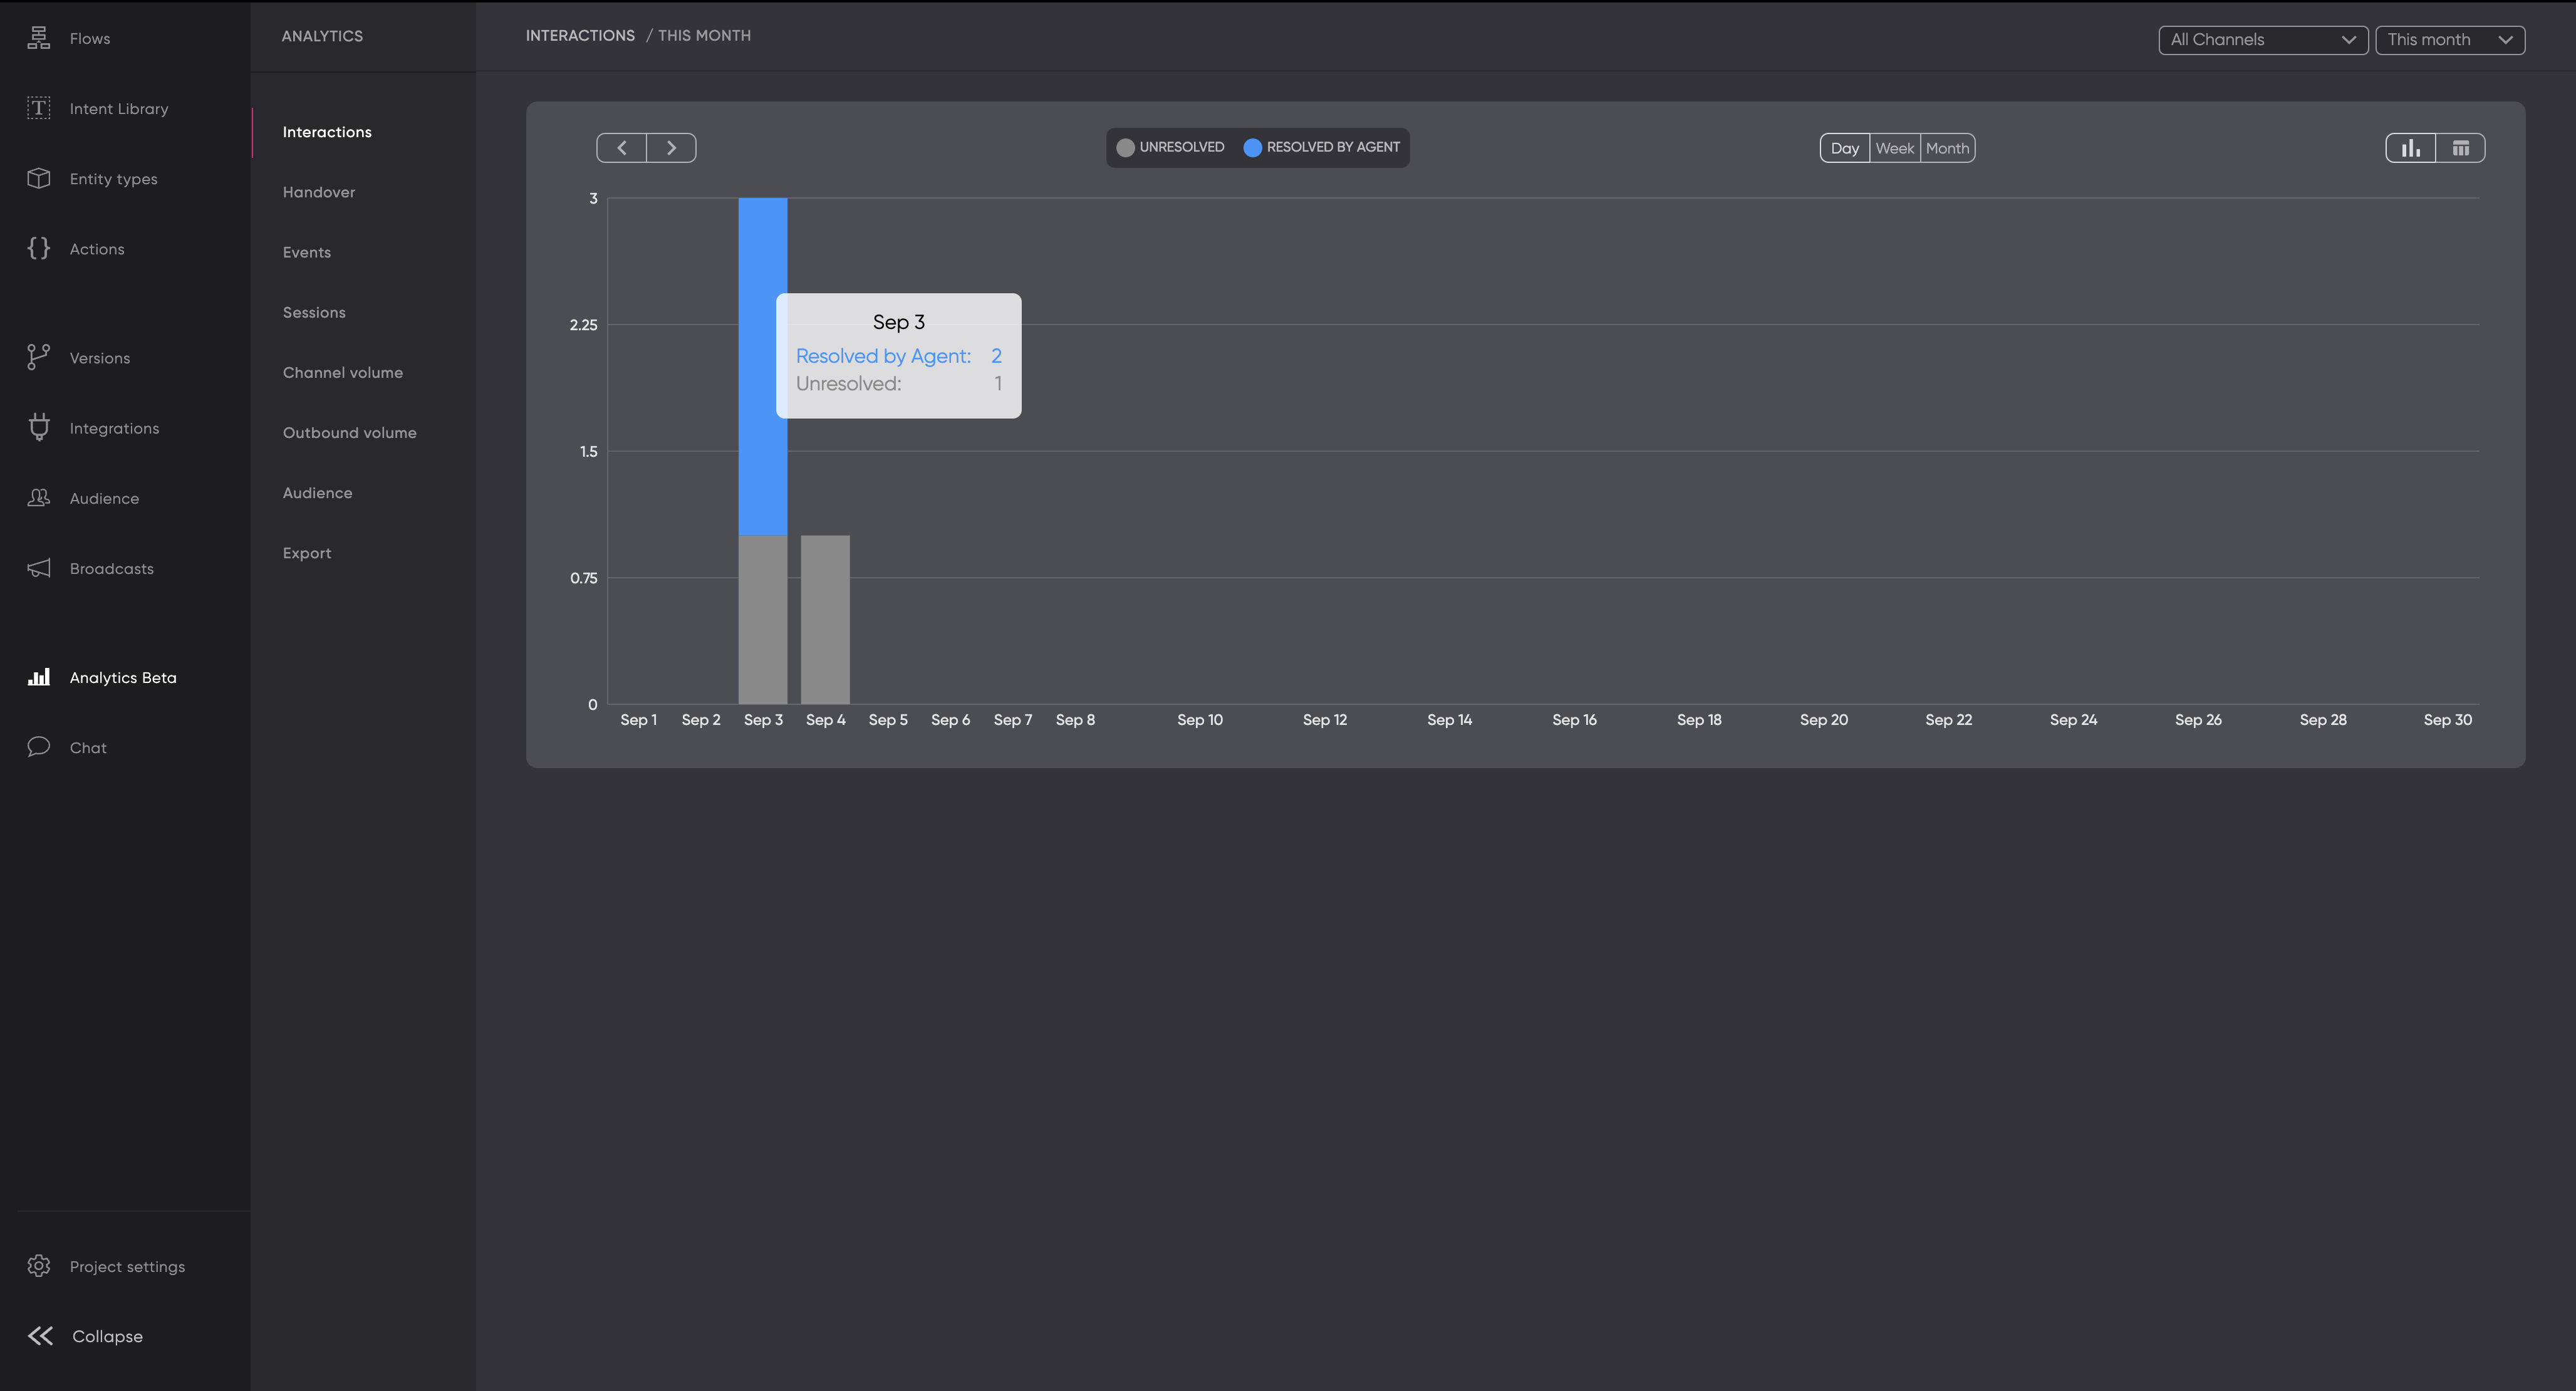
The graph shows interactions in Flow Analytics for September. On September 3rd, there were 2 resolved and 1 unresolved interaction. Resolved interactions are blue, and unresolved ones are gray.
2. Handover
Overview:
The Handover section in Flow Analytics tracks when conversations are passed from the system to an agent. It helps users monitor when and how often handovers occur, offering insight into how frequently automated interactions require agent assistance.
Key Features
- Handover Tracking: The graph shows the number of handovers per day, marked in blue for quick reference.
- Date Range Options: Users can toggle between daily, weekly, or monthly views to examine trends. In the screenshot, the monthly view is selected.
- Channel Filters: Easily filter handover data by communication channel using the drop-down menu at the top right.
- Hover-Over Insights: Hovering over a specific date reveals the exact number of handovers on that day. For instance, on September 4th, there was 1 handover.
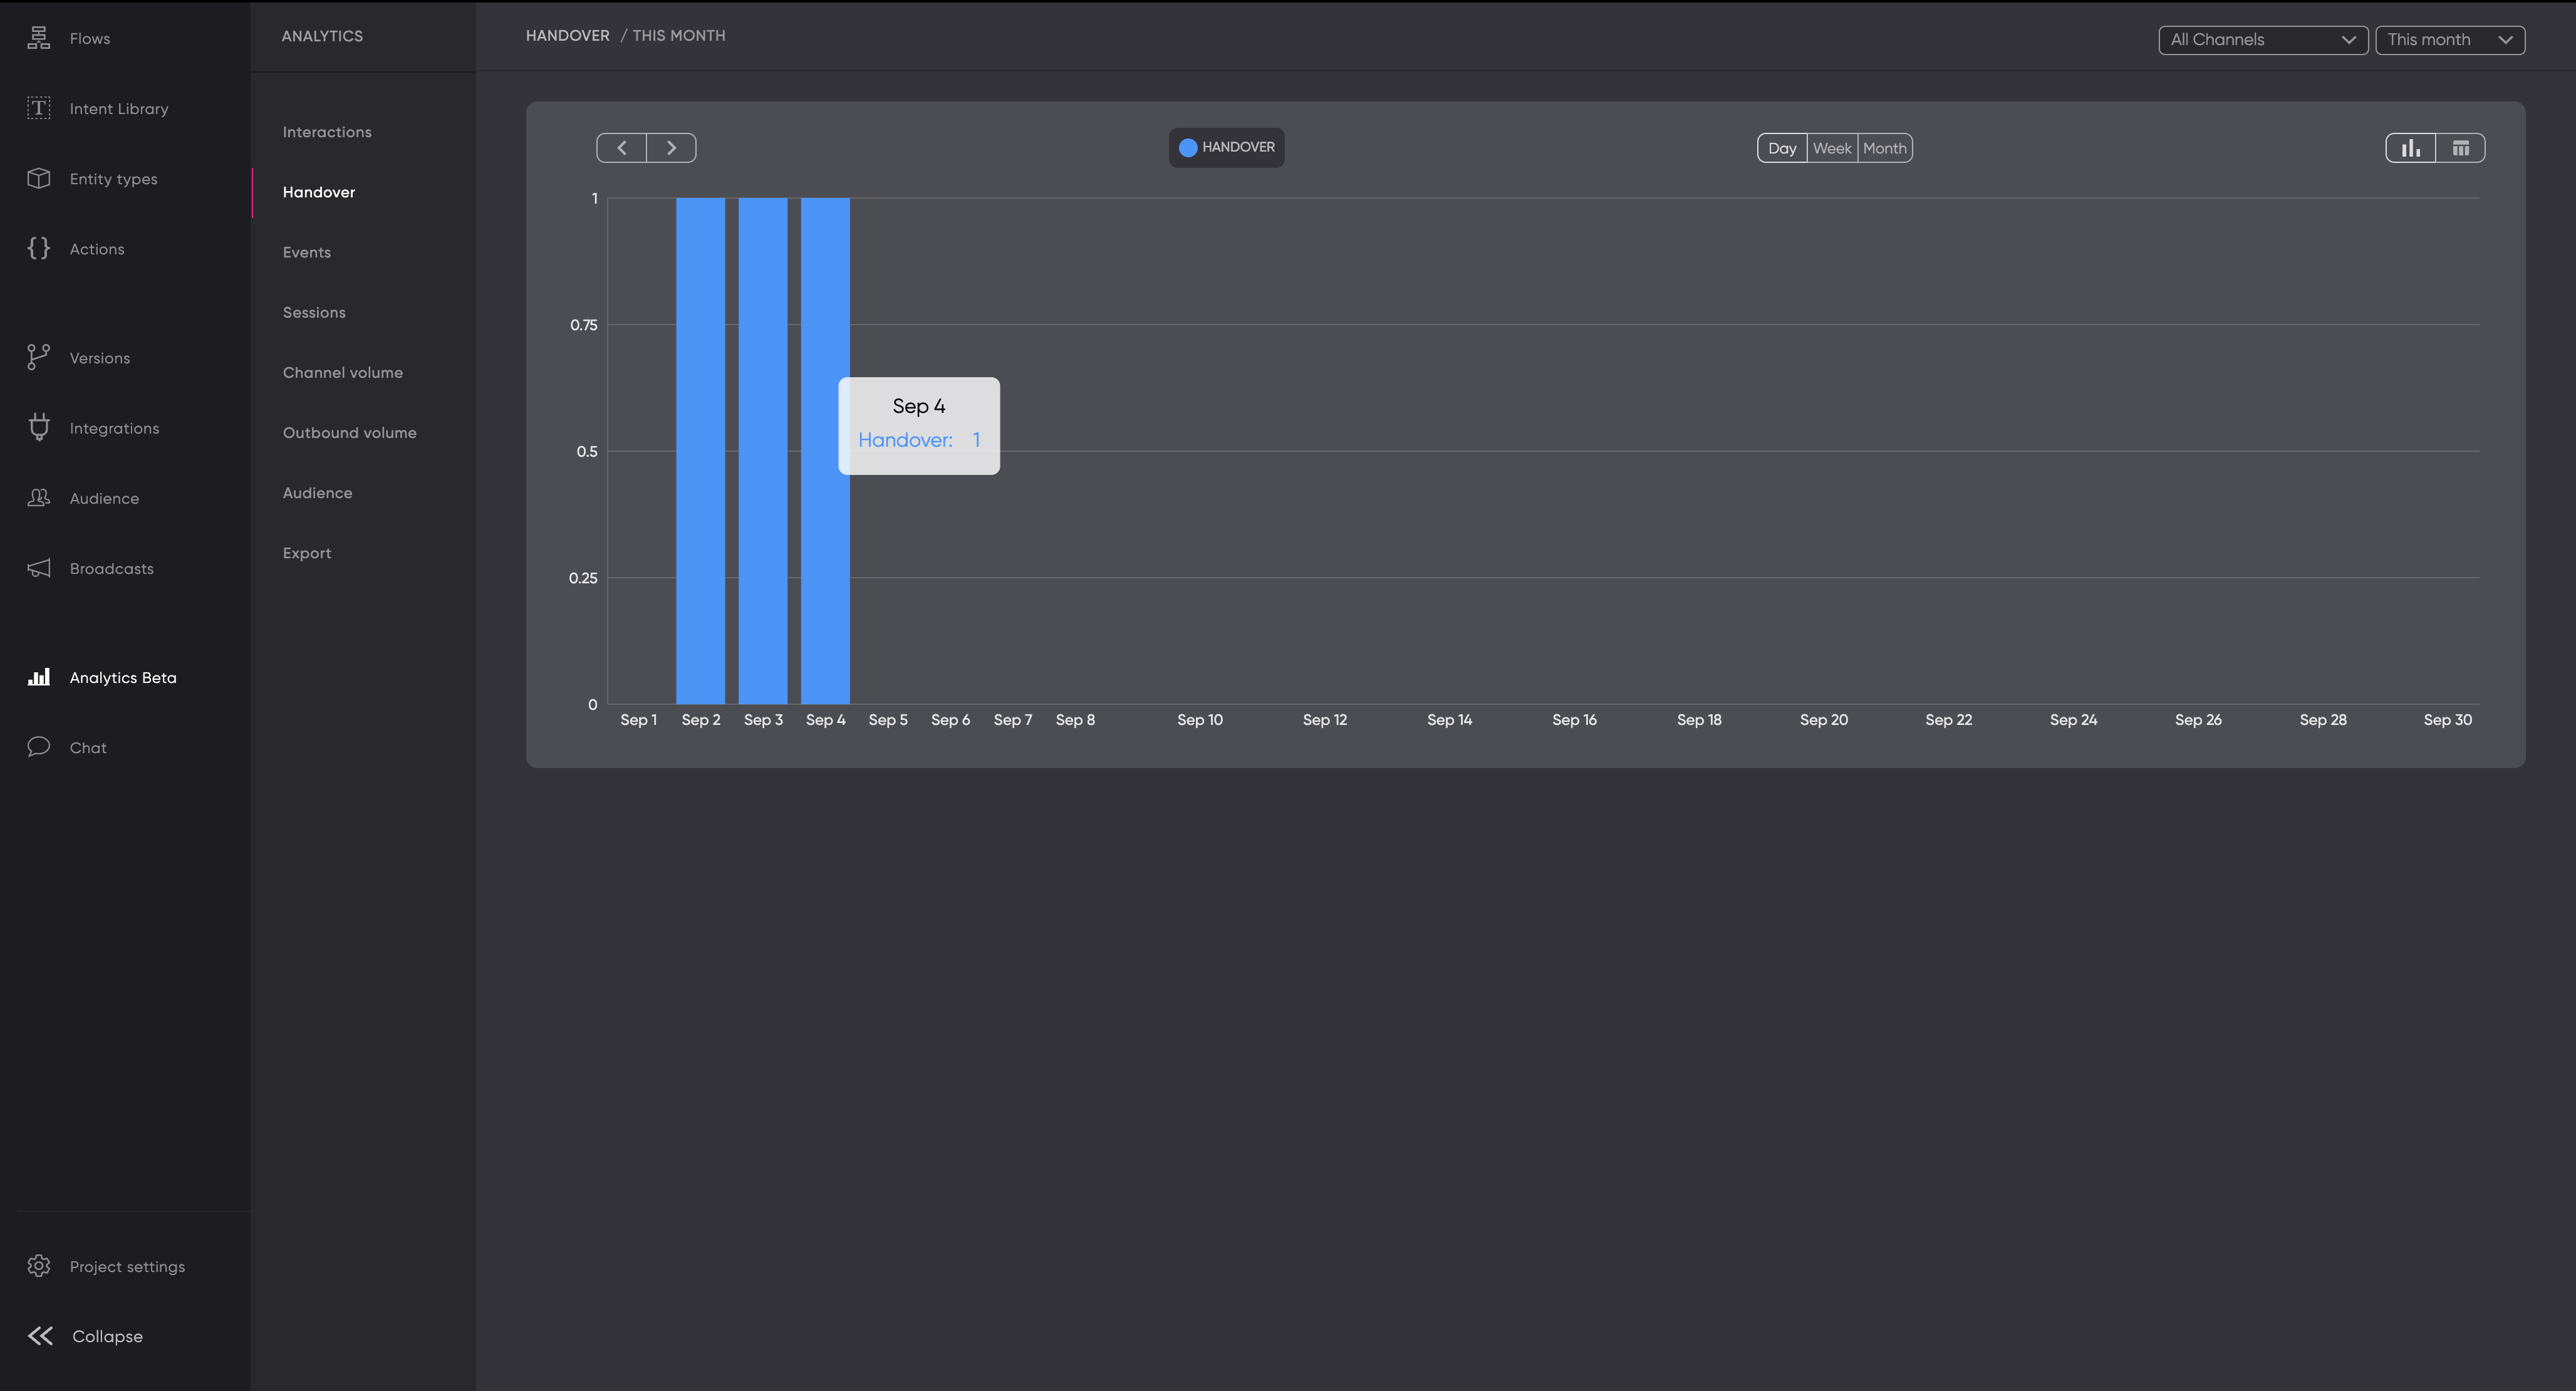
The graph in Flow Analytics shows handover data for September, with blue bars indicating handovers. The hover-over detail for September 4 shows 1 handover.
3. Events
Overview:
The Events module tracks specific events within the customer interaction flow, such as escalations, responses, and other key actions. It is useful for monitoring and analyzing critical events that affect customer service performance.
Key Features:
- Real-time event tracking.
- Customizable filters to focus on specific events.
The Events module shows how events are logged and displayed, allowing for detailed analysis of specific occurrences within the interaction flow.
4. Sessions
Overview:
The Sessions section in Flow Analytics tracks the number of distinct user sessions over a selected time period. It provides insight into overall traffic, session volume, and user engagement within the platform.
Key Features
- Session Tracking: The graph displays the number of sessions per day, with blue bars representing session counts.
- Date Range Options: Users can view session data by day, week, or month. In the screenshot, the monthly view is selected.
- Channel Filters: You can filter sessions by different communication channels using the drop-down menu at the top right.
- Hover-Over Insights: Hovering over a specific date provides the exact number of sessions on that day. For example, on September 3rd, there were 3 sessions tracked.
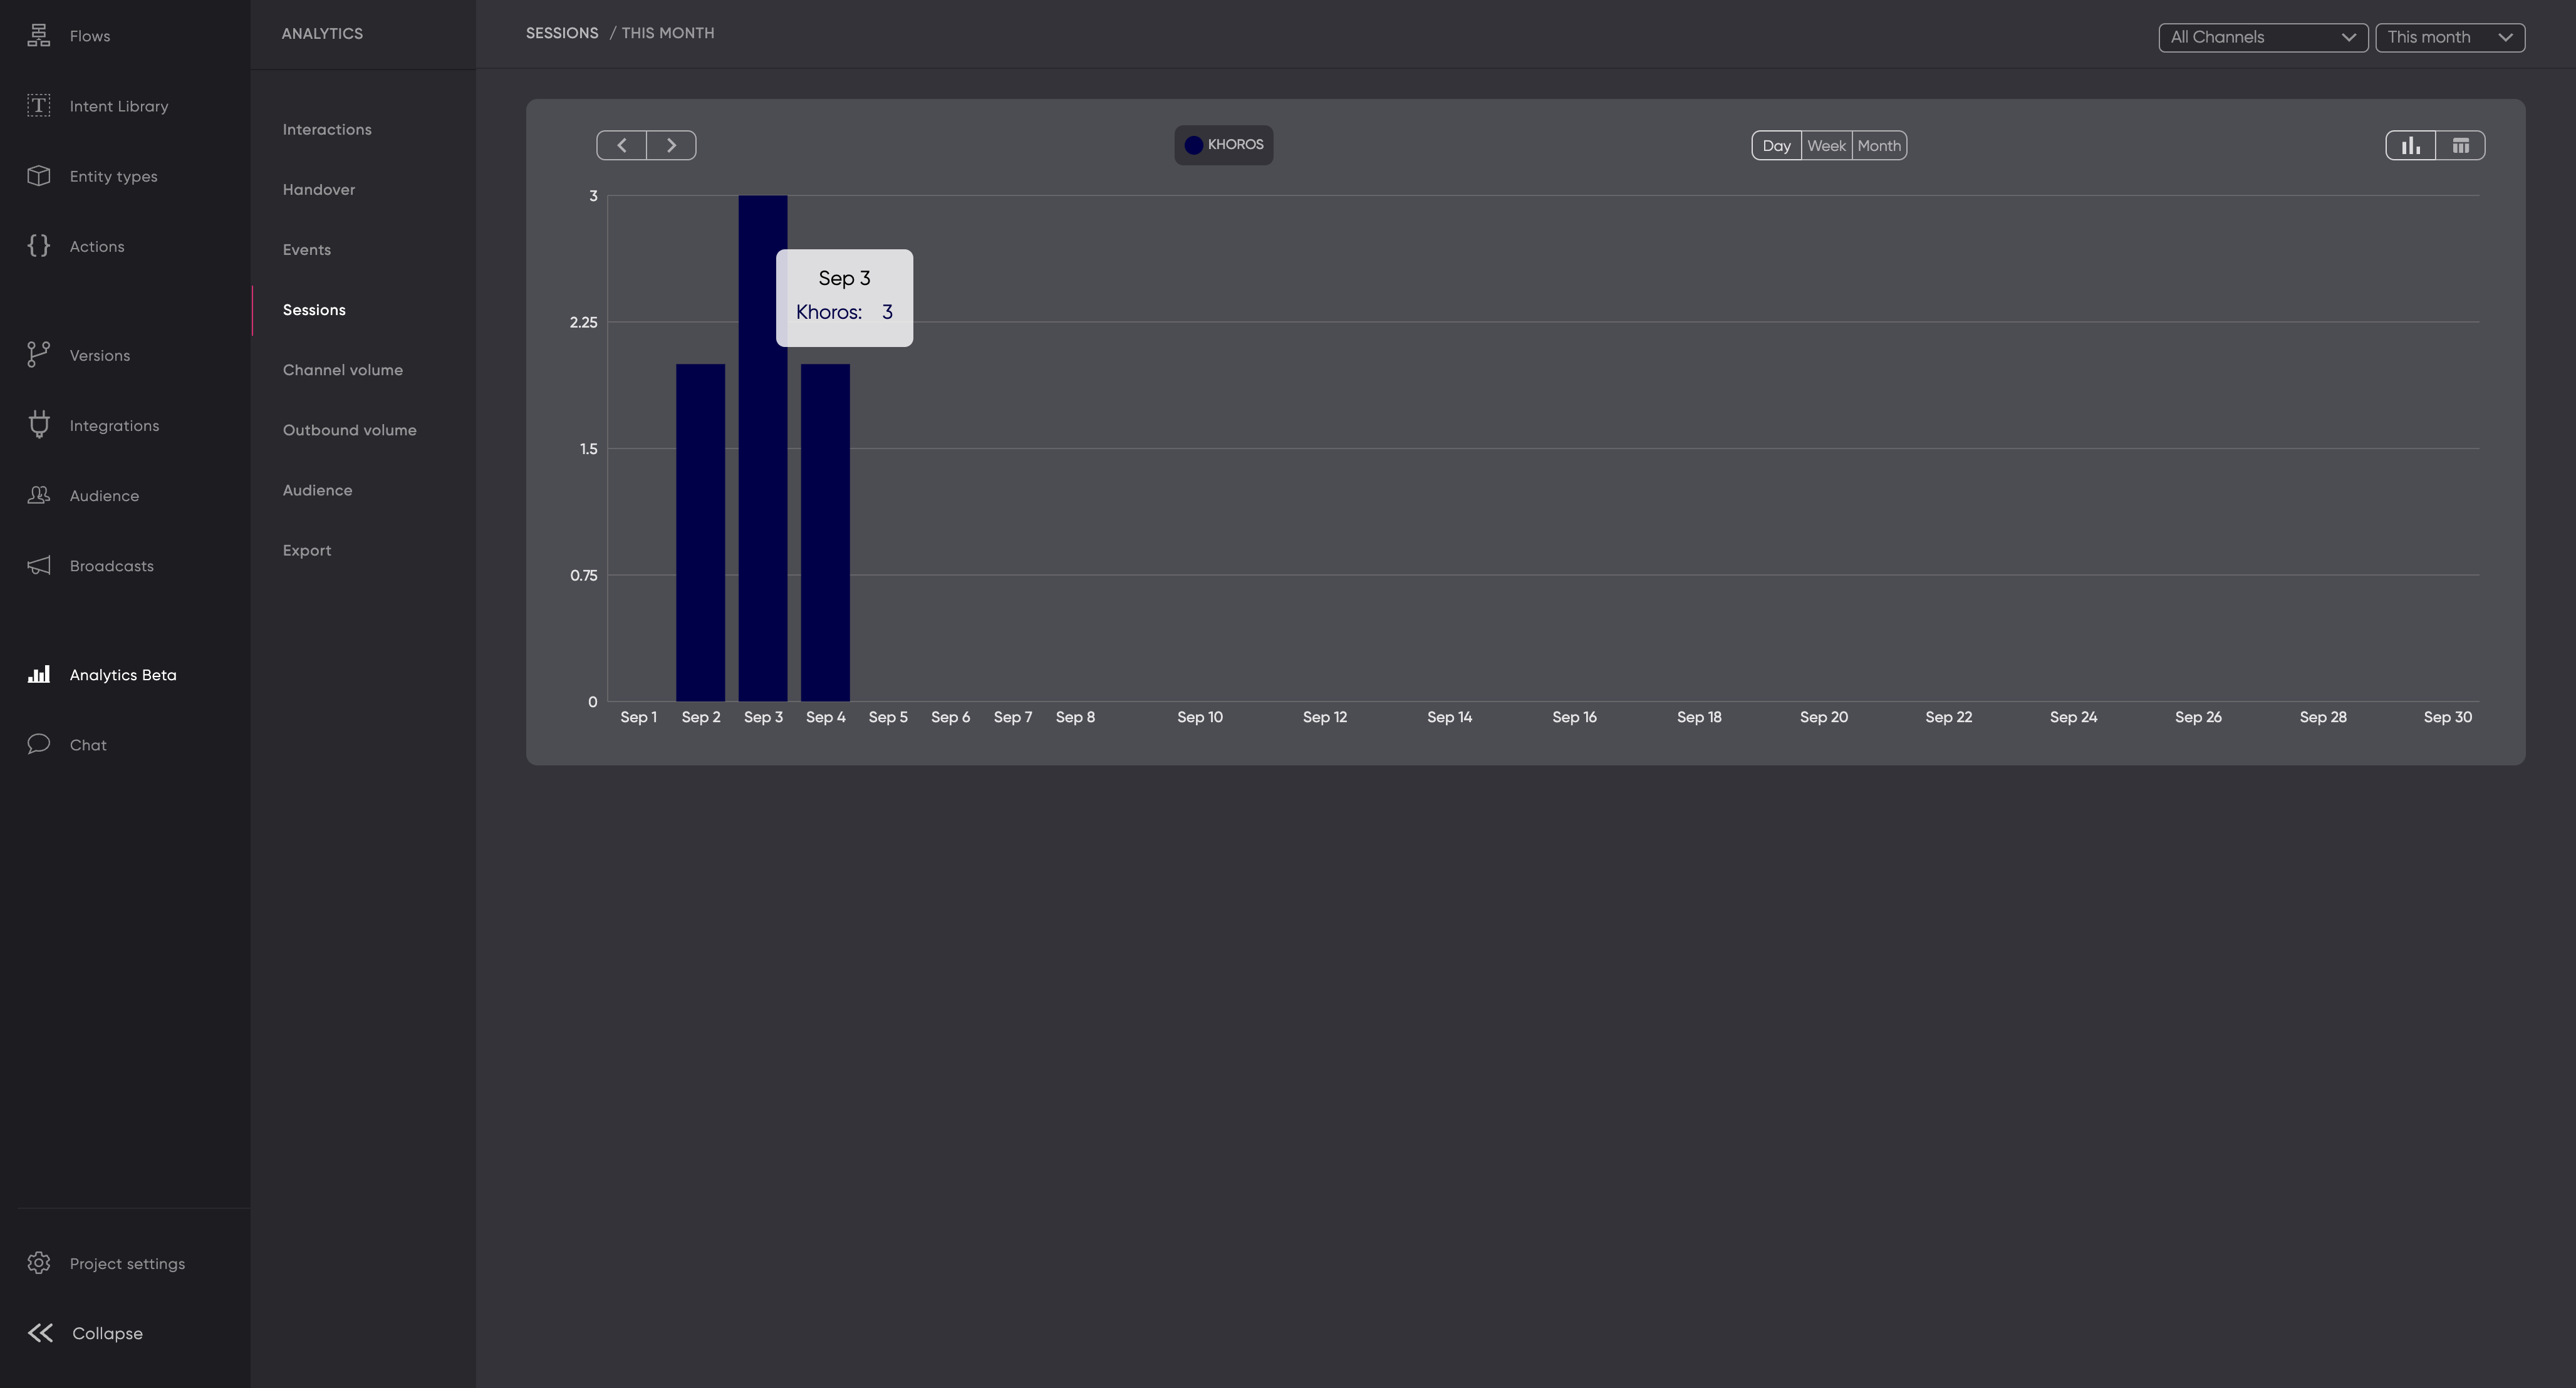
This image shows Session data for September, with blue bars representing the number of sessions. The hover-over detail for September 3rd shows 3 sessions.
5. Channel Volume
Overview:
The Channel Volume report in Flow Analytics tracks the number of interactions across different channels within a selected time frame. This visualization helps users monitor channel activity, ensuring that engagement levels are effectively managed.
Key Features:
- Time Frame Selection: Choose between day, week, or month views to analyze interaction trends over time.
- Channel Filter: Focus on specific channels to understand platform-specific performance.
- Data Representation: Visualize interaction counts using bar charts for quick comparisons.
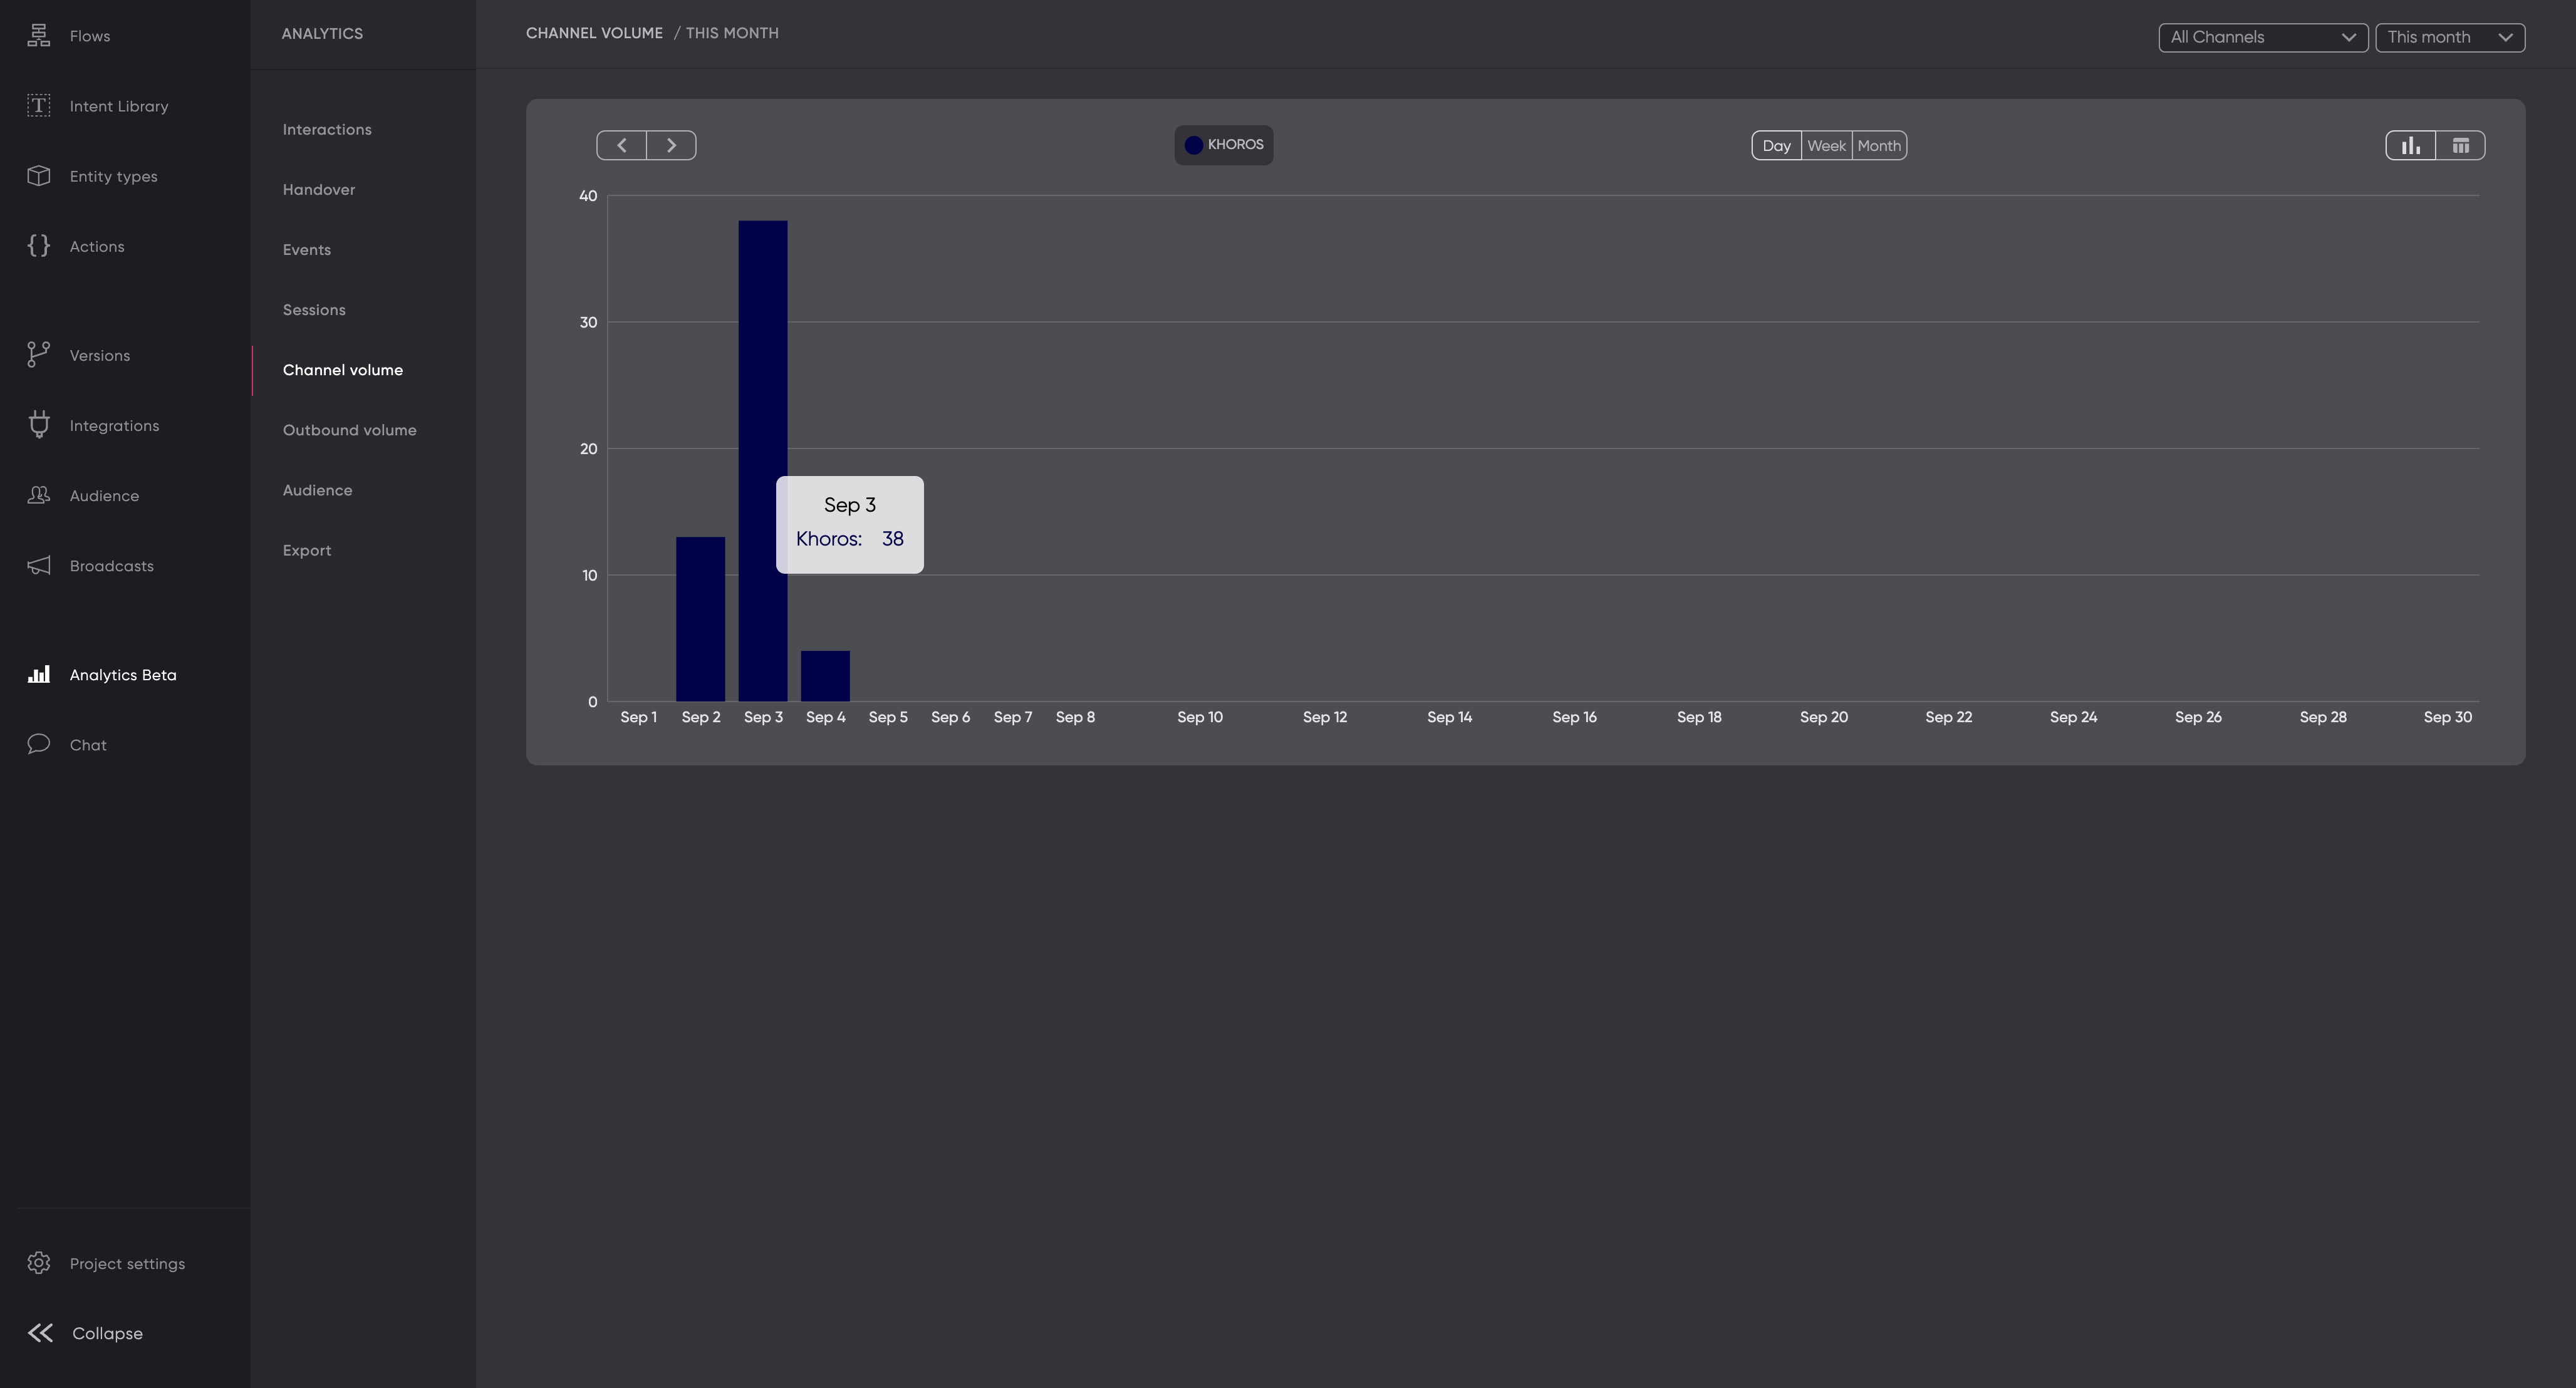
A bar chart displaying interaction counts on different days in September. The highlighted bar shows 38 interactions on September 3, with options to filter by day, week, or month. The chart also allows filtering by channel.
6. Outbound Volume
Overview
The Outbound Volume report in Flow Analytics tracks the number of messages sent by agents and bots. This helps users assess the efficiency of automated and manual interactions over a selected period.
Key Features:
- Agent vs. Bot Comparison: Visually compare the volume of messages sent by agents and bots.
- Time Frame Selection: Choose day, week, or month views to understand messaging trends.
- Channel Filter: Narrow down results by specific channels for more detailed insights.
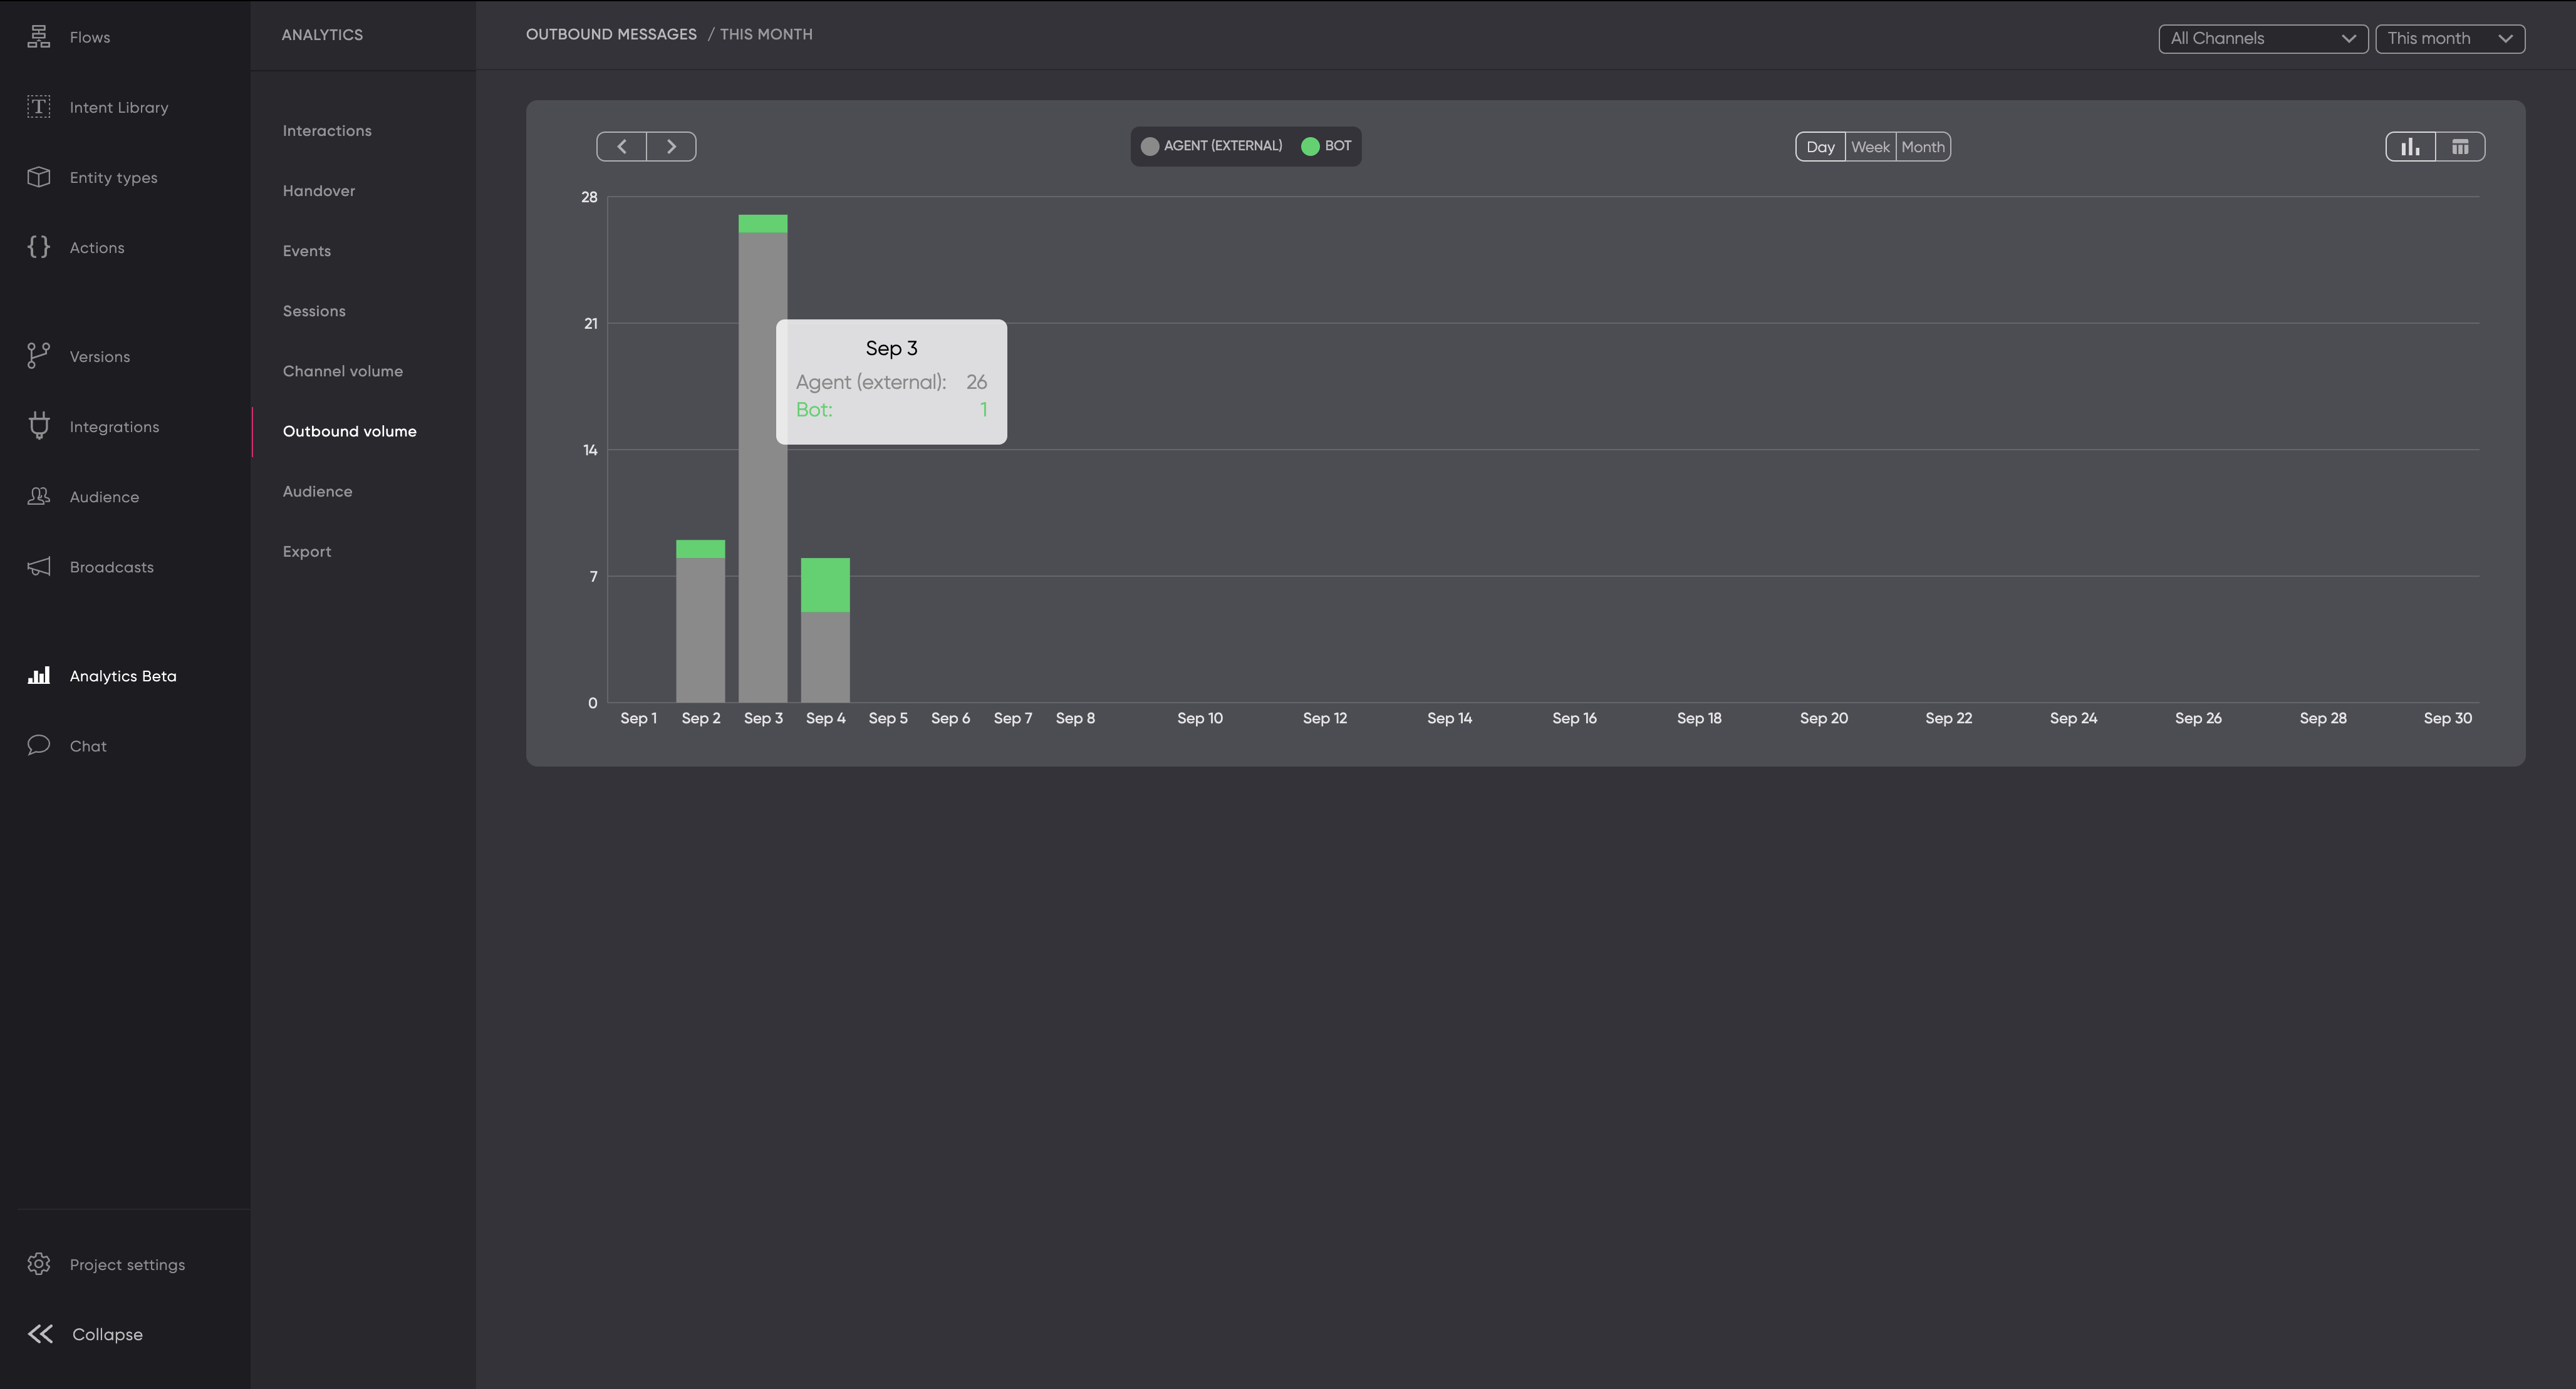
A bar chart showing outbound messages in September, with gray bars representing agent (external) messages and green bars representing bot messages. The highlighted bar shows 26 agent messages and 1 bot message on September 3. Options to filter by day, week, or month are available, with This month selected by default.
7. Audience
Overview
The Audience report in Flow Analytics provides insights into new users interacting with the platform over a selected time frame. This data helps track user acquisition and engagement trends.
Key Features:
- New Users Tracking: Monitor the number of new users engaging with the platform.
- Time Frame Selection: View data by day, week, or month to analyze user growth over time.
- Channel Filter: Focus on specific channels to gain insights into where new users come from.
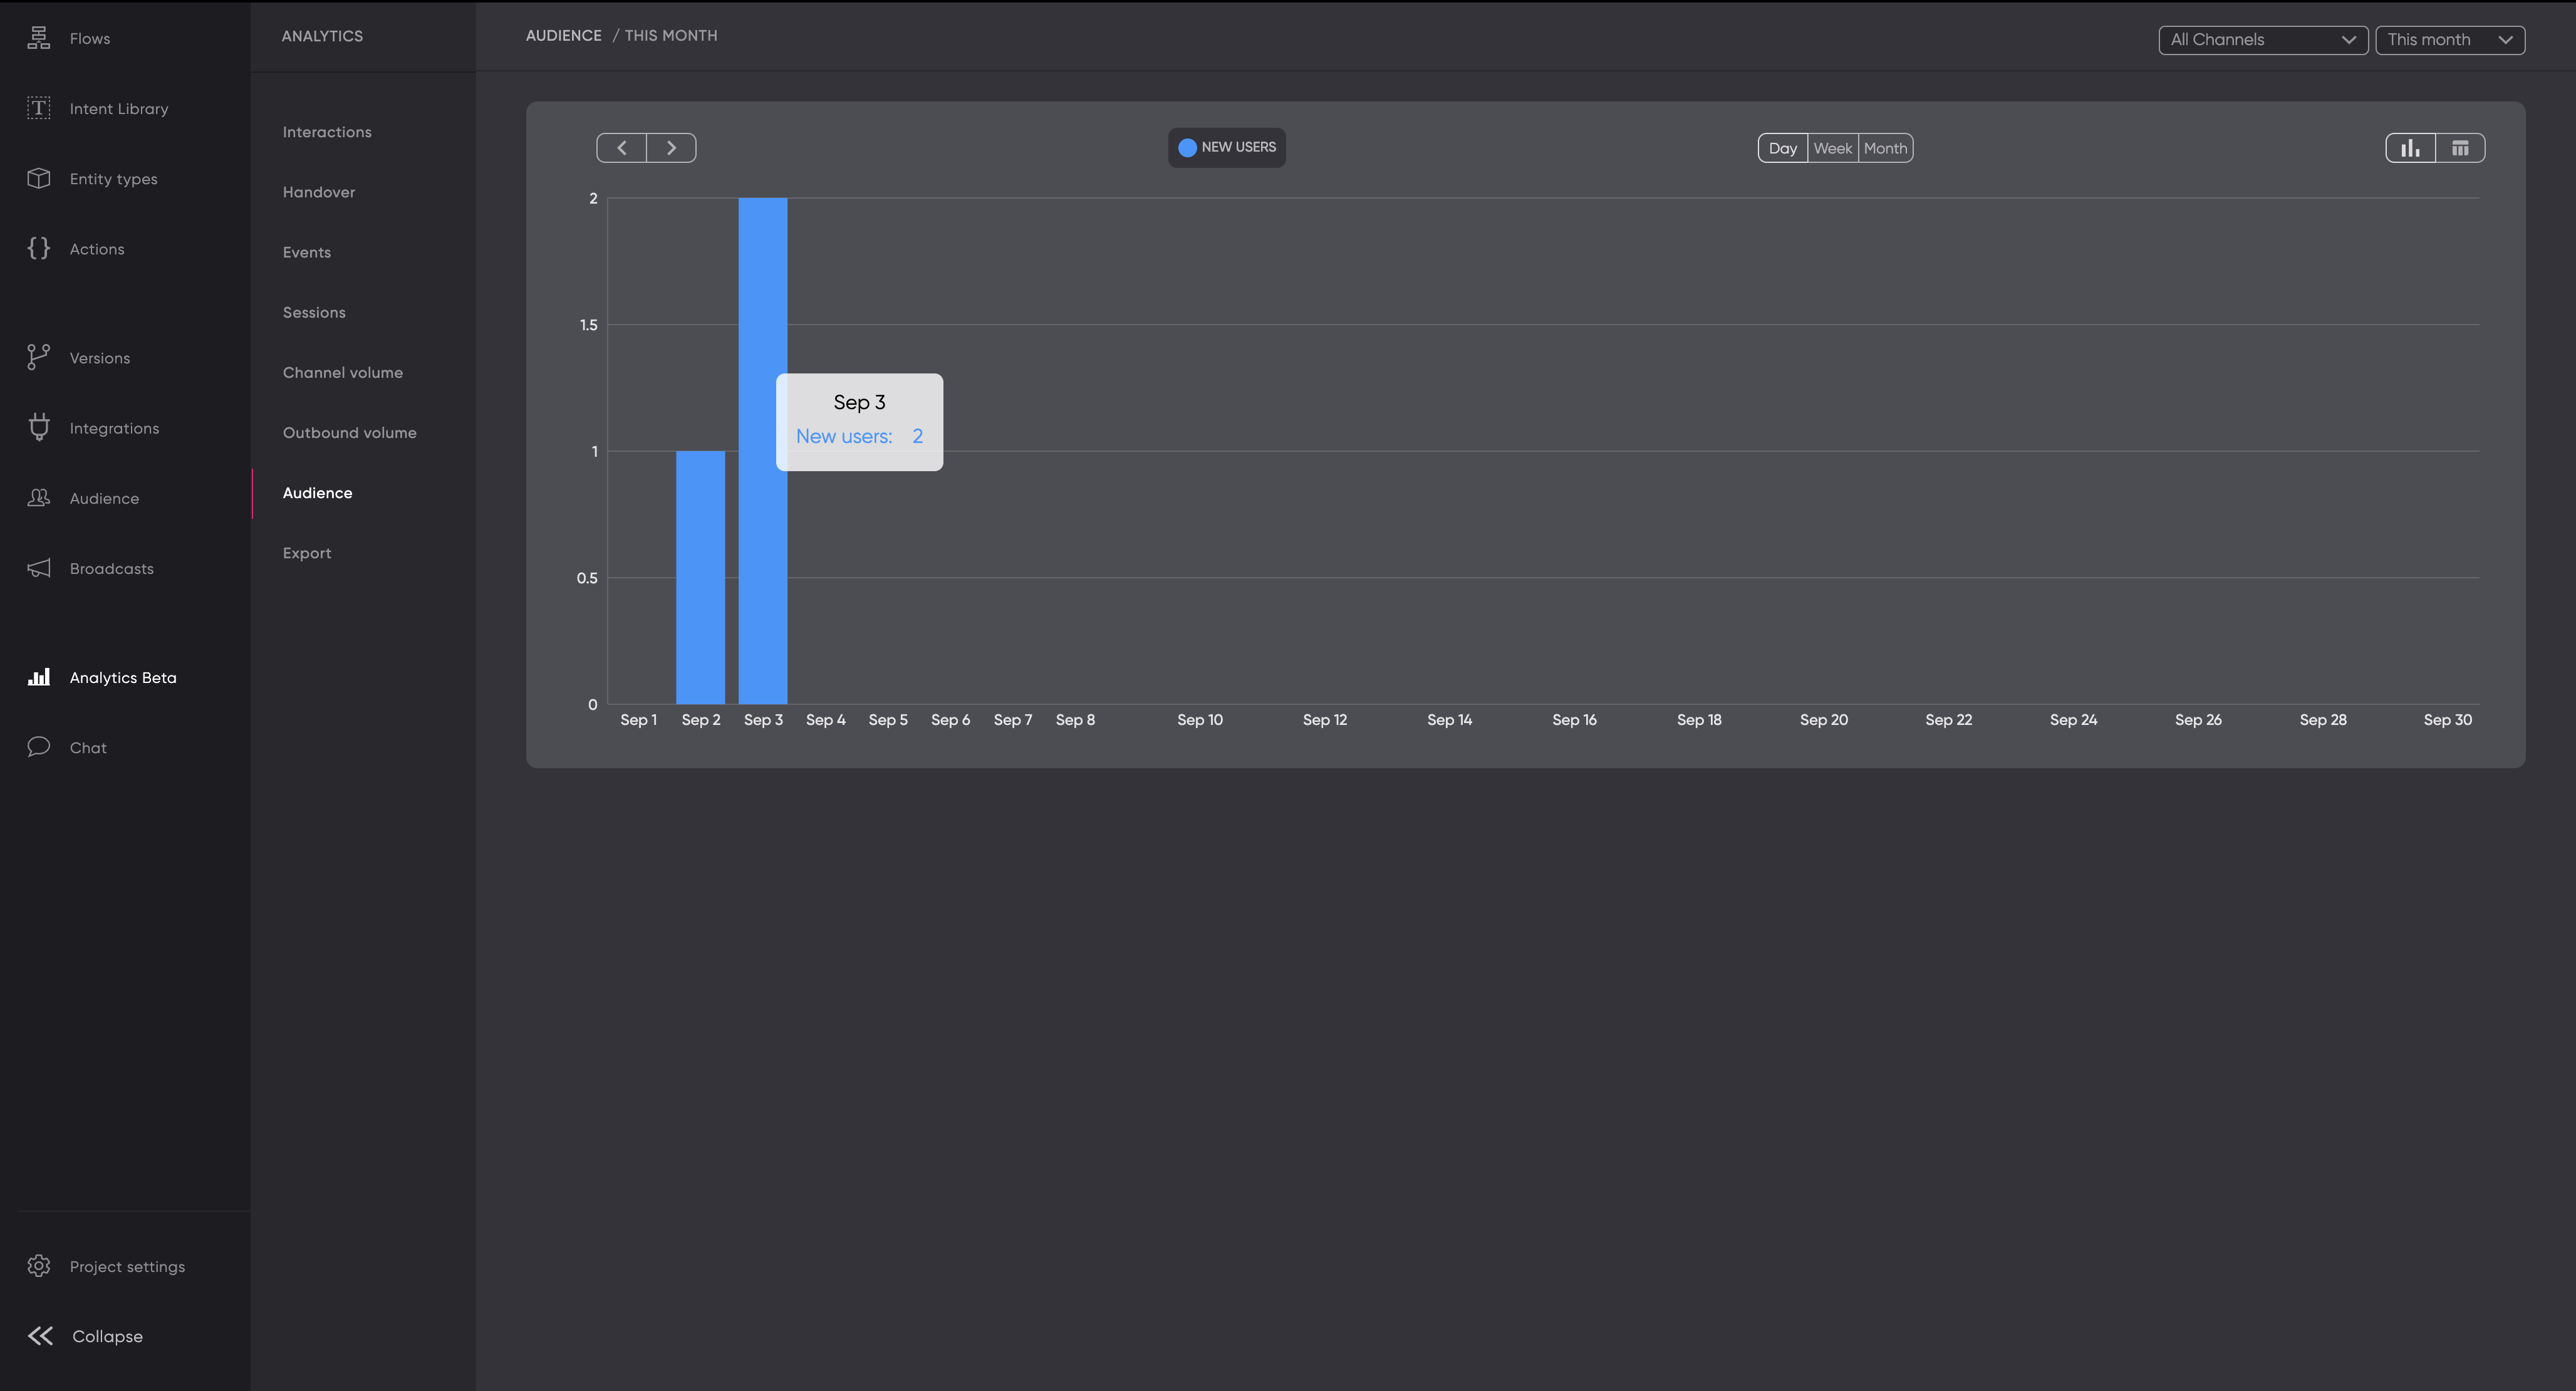
A bar chart showing new users in September, with a highlighted bar indicating 2 new users on September 3. Options to filter data by day, week, or month are available, with This month selected by default.
8. Export
Overview
The Export feature in Flow Analytics enables users to extract analytics data. This feature provides a flexible way to transfer data into external storage solutions for further analysis or backup.
Key Features:
- Storage Type Selection: Users can choose from various storage options: Amazon S3, Google Storage, Microsoft Azure Blob, and OBS S3. This flexibility ensures compatibility with most modern cloud platforms.
- Customizable Reporting Attributes: Configure reporting parameters such as Region, Country, Client Identifier, and Use Case Identifier to tailor reports based on specific needs.
- Manual Exports: Users can initiate manual exports and view the status of completed exports directly on the interface. The Download button provides quick access to exported data.
- Export Scheduling: Set up and manage automatic export configurations using the Analytics API for seamless data flow.
- Reset and Save Options: Easily reset configurations or save current settings for future use, streamlining the data export process.
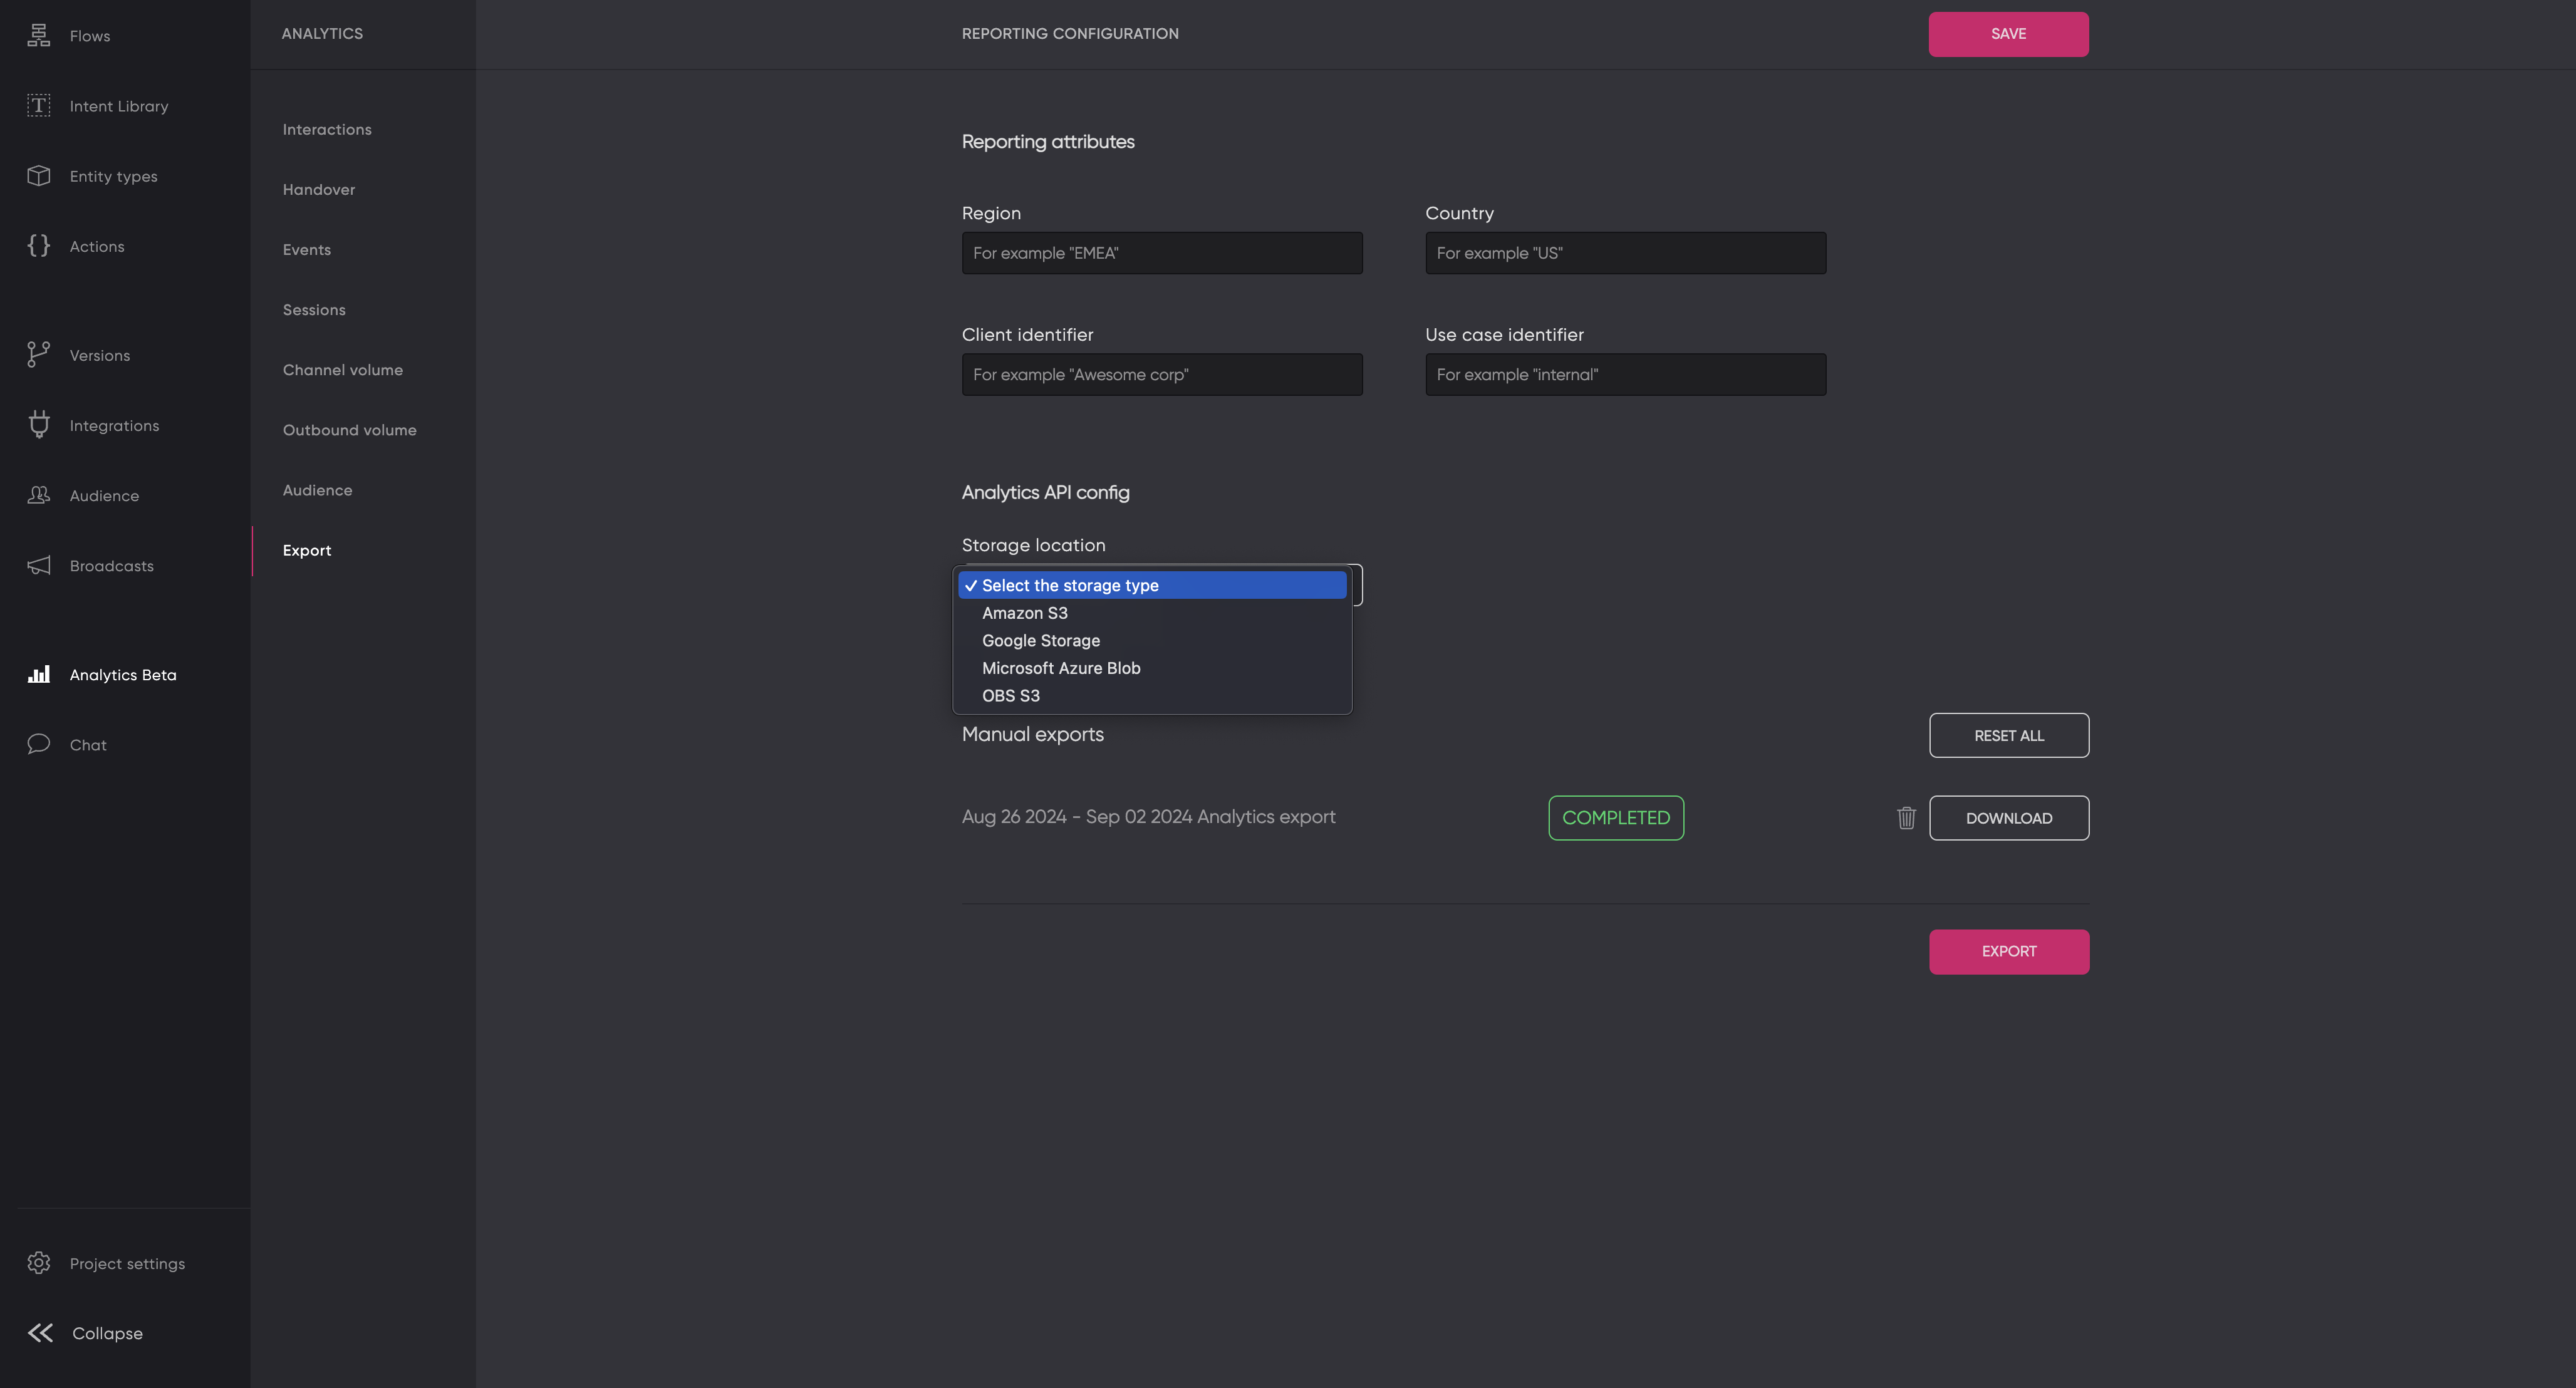
The image shows the Export section within the Flow Analytics interface. Users can select storage types and configure reporting attributes. There are options for saving, resetting, and downloading completed exports.
Updated 2 months ago