
Khoros Flow Key Metrics
Flow Key Metrics provide real-time insightful data that helps you evaluate the overall performance of the bot by:
- Automation Rate
- Resolutions by Bot or Agents
- Inbound and Outbound Messages
- Outbound Volume
Tracking and analyzing these metrics provide valuable insights into the performance and overall effectiveness of your bot. By continuously monitoring these metrics and making iterative improvements, you can ensure that your bot best serves your users and meets your business goals.
To access Flow key metrics, go to Performance > Key Metrics.
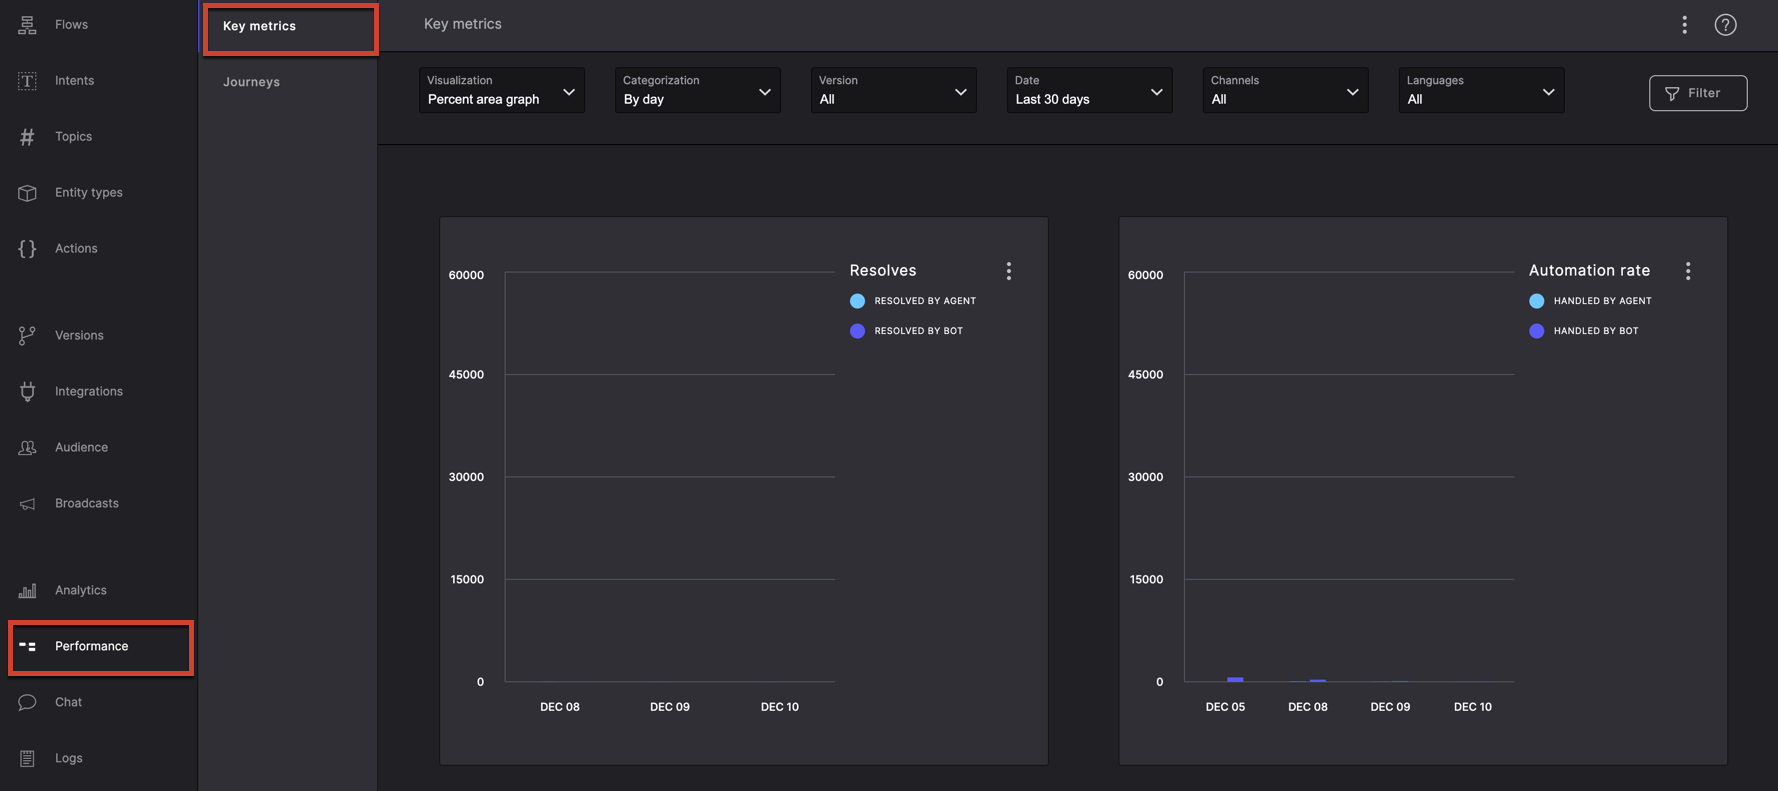
Note:Performance is available for the production environment only and is not displayed for the development environment or drafts.
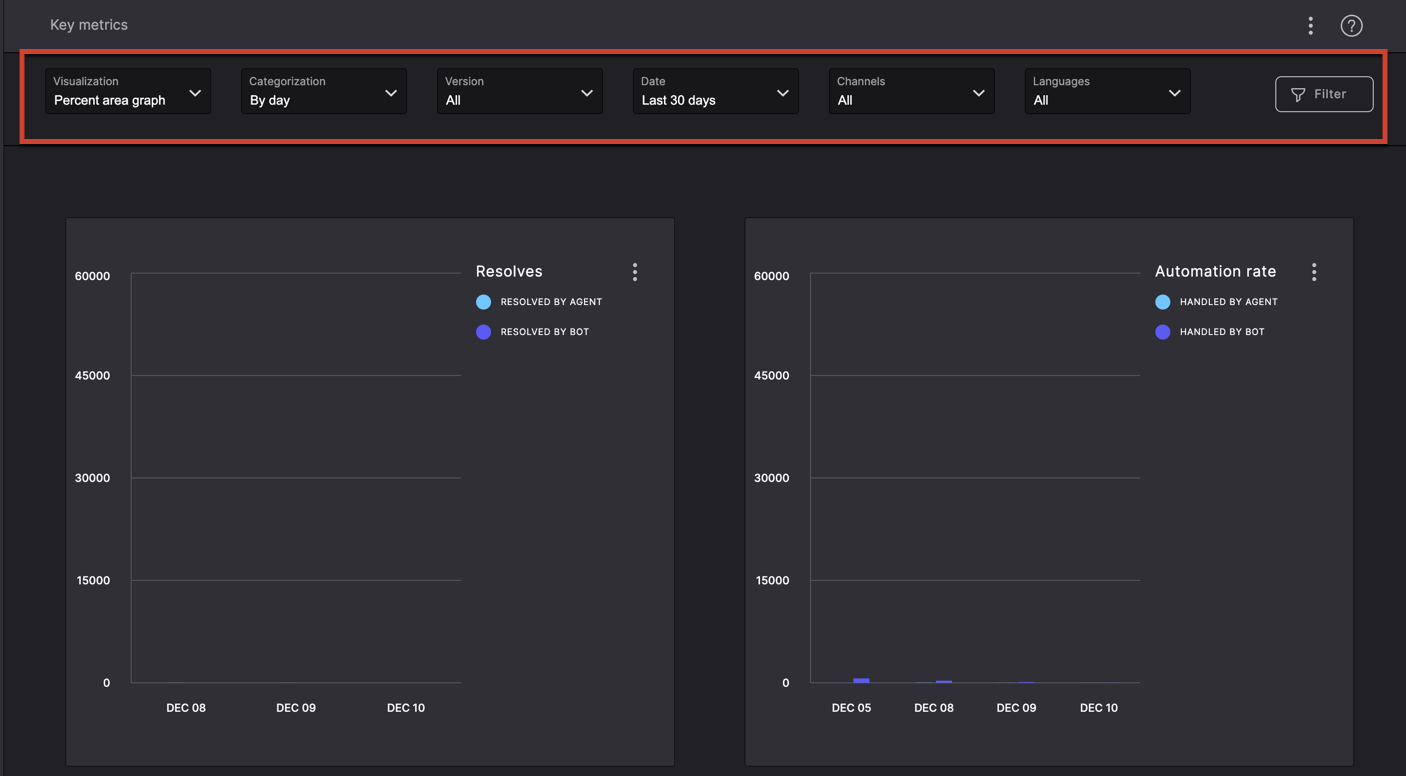
Key Metrics Filters
The key metrics filters help narrow down the data with specific parameters. Use the following options to filter the data and click Filter.
Visualization
From the Visualization drop-down menu, you can select the following:
- Percent area graph: displays the data statistical representation with percentages.
- Percentage table: displays tables with percentages.
Categorization
From the Categorization drop-down menu, you can select the following:
- By Month: displays data based on the months.
- By Week: displays data based on the week of a month.
- By Day: displays data based on the days of the week.
- By Channel: displays data based on the source channels.
Versions
From the Versions drop-down menu, select the production versions of the project to use the date range from when these versions were live.
Date
From the Date drop-down menu, select the following:
- Yesterday: displays the data of the previous day.
- This month: displays the data of the current month up to the current date.
- This week: displays the data of the current week up to the current date.
- Last month: displays the data from the last month.
- Last week: displays the data from the last week.
- Last 30 days: displays the data from the last 30 days up to the current date.
- Last 7 days: displays the data from the last 7 days up to the current date.
- Custom: displays the data from the date range between the Start Date and End Date options.
Channels
From the Channels drop-down menu, select the channel to display data from a specific source channel.
Languages
From the Languages drop-down menu, select the language to display data of a specific language used in the interaction.
Key Metrics Boards
The metrics on the boards display the data (graph or tabular) through the timeframe of the current month along with the number of activities performed. The metrics are displayed in terms of percentages as well as the total number of activities.
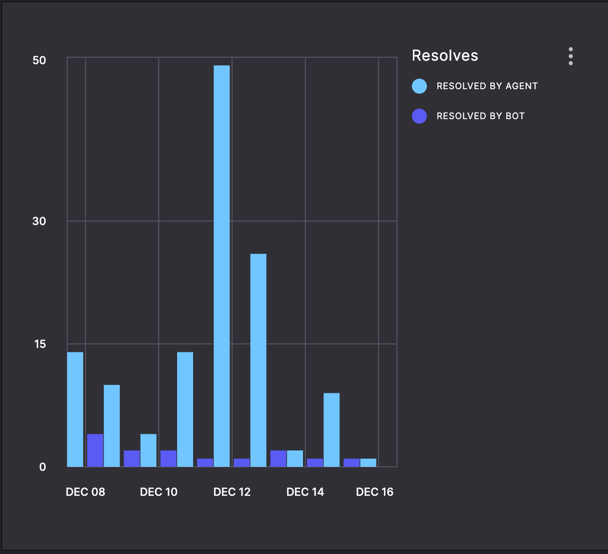
Resolves
Resolution is based on the number of interaction resolutions by the bot or the agents.
The Resolves board displays the comparison of the number of resolutions provided by the agents versus the number of resolutions provided using the bot.
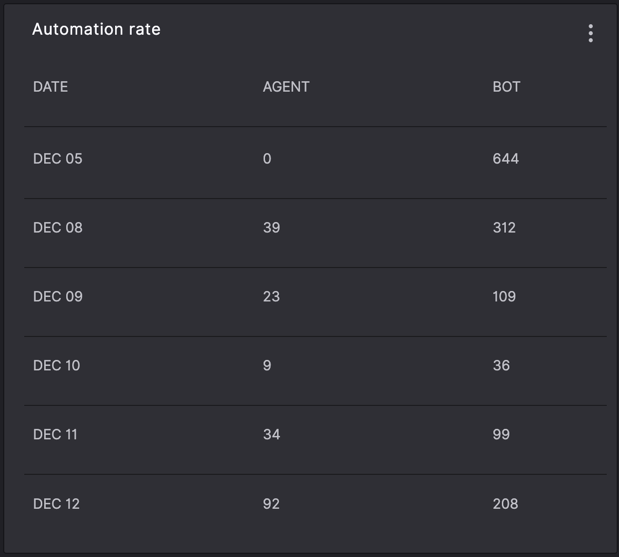
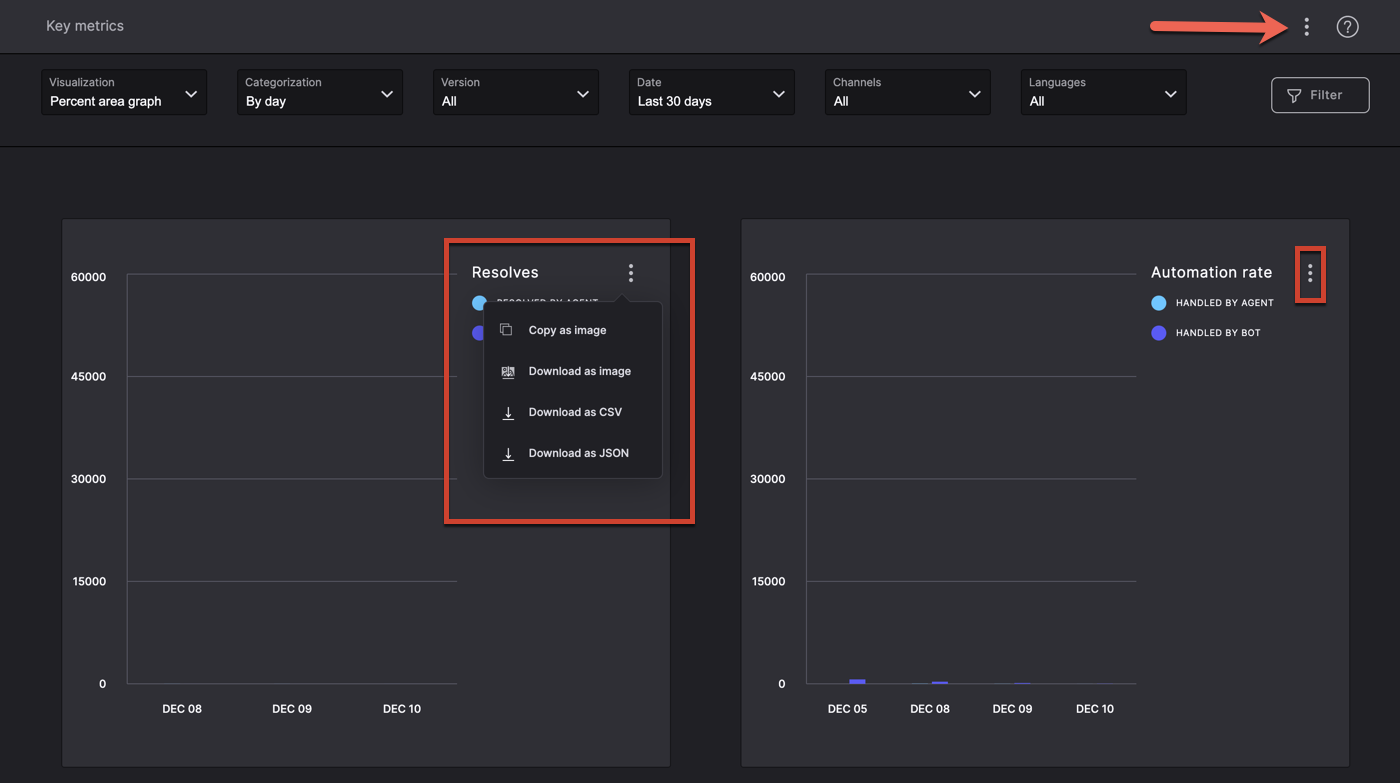
Automation rate
The Automation rate board displays the comparison of the number of automations handled by the agents versus the number of automations handled by the bot. We measure this by checking for each message (both inbound and outbound), resolve, and handover if the bot or an agent was in control of the conversation at that time.
In the example below, the automation rate is displayed in tabular format based on the date of automation.
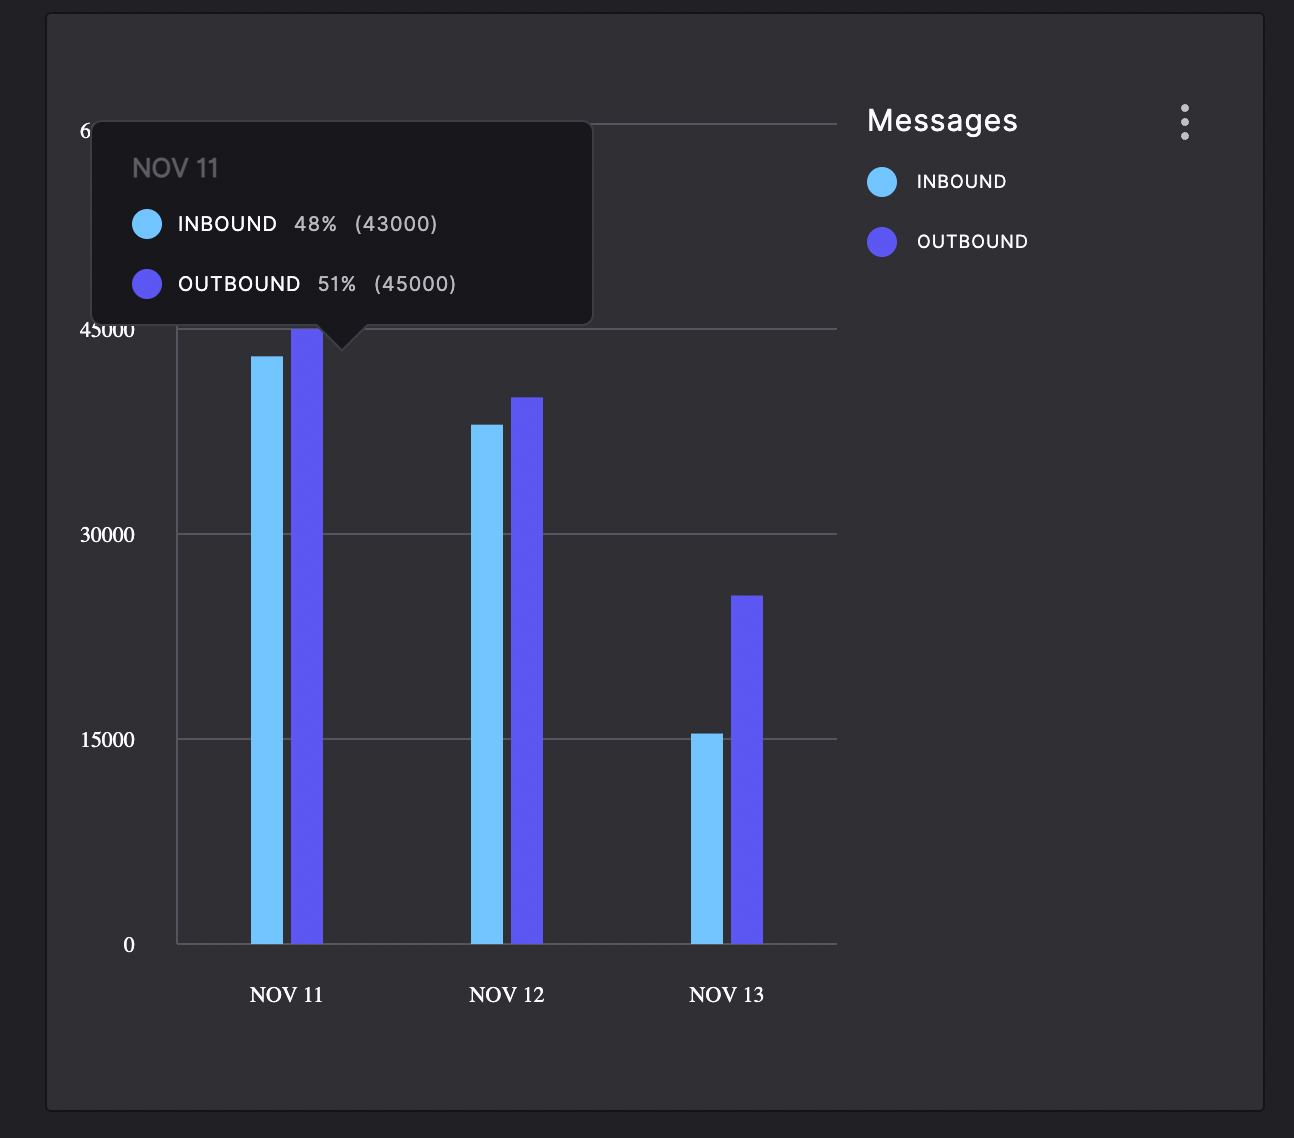
Messages
Inbound messages are customer inquiries about your product or services. Outbound messages are the responses or resolutions by the bot or the agents. Each inbound message is counted separately even though the customers send multiple messages in a row.
The Messages board displays the comparison of the number of inbound messages versus the number of outbound messages. You can hover your cursor over the graph to see the percentages and total number of messages.
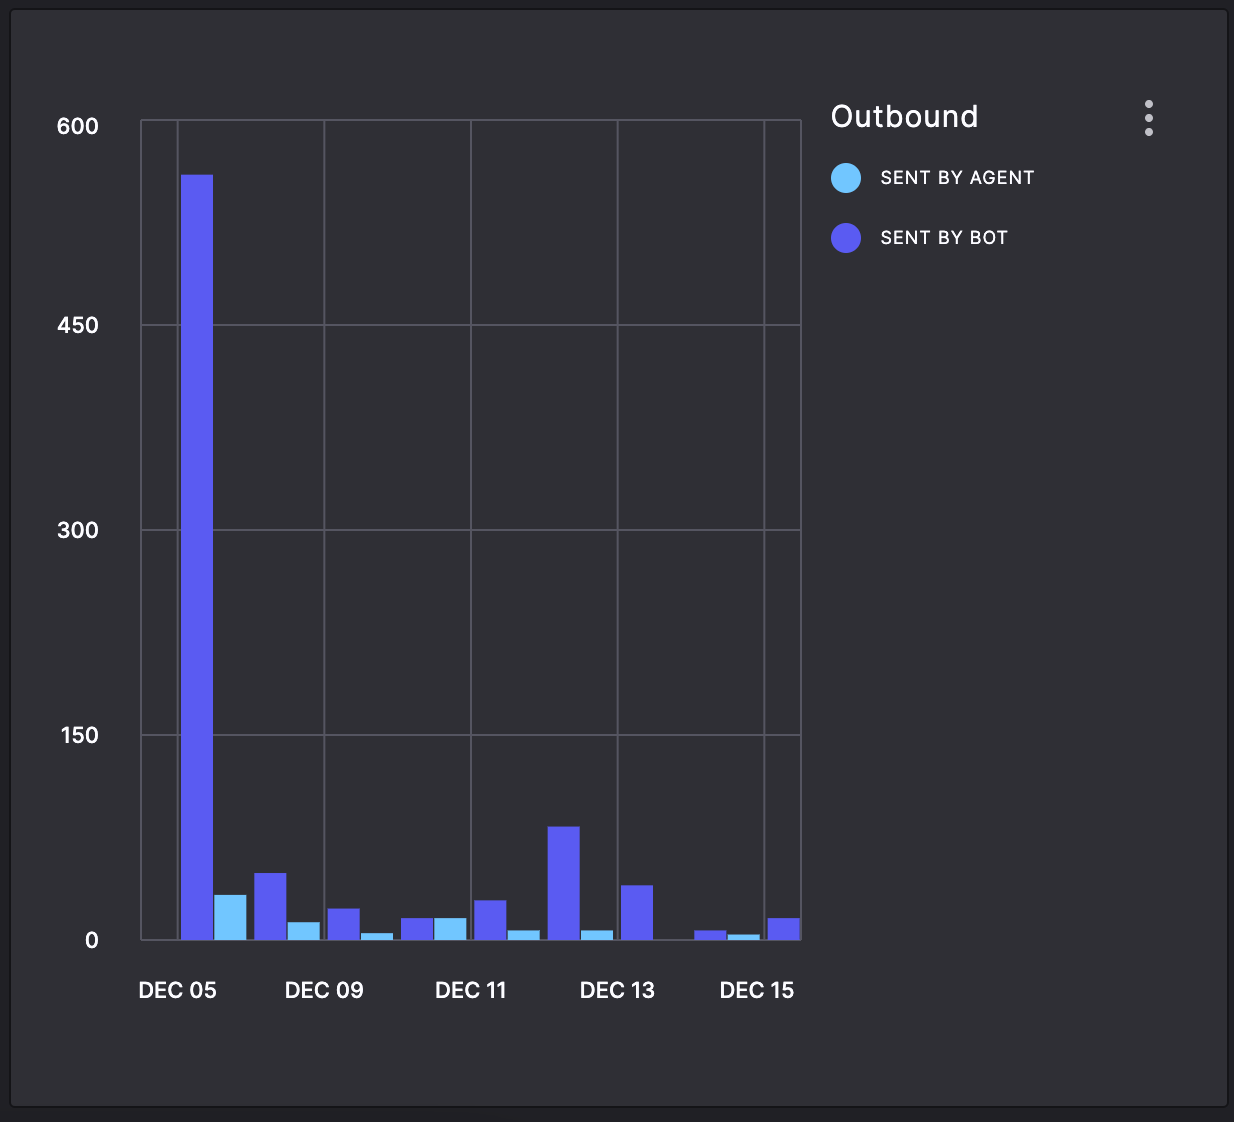
Outbound
The Outbound board displays the comparison of the number of outbound messages by the bot versus the number of outbound messages by the agents.
Download reports
You can download the key metrics report for the entire project from the global Options menu and also download the report of a specific board from the board’s Options menu. To download a report, you can:
- Copy as image
- Download as image
- Download as CSV
- Download as JSON
Updated 2 months ago